If you are a Sysadmin, monitoring bandwidth usage on your server is an important task. We agree some of you might have bandwidth graphs on your server monitoring platform or on your server provider’s control panel. But having the ability to monitor the bandwidth in real time helps to solve many problems.
On this post you will find out 2 different, simple command line bandwidth monitor tools to view the outgoing and incoming bandwidth consumption in real time. You will only need one.
Slurm
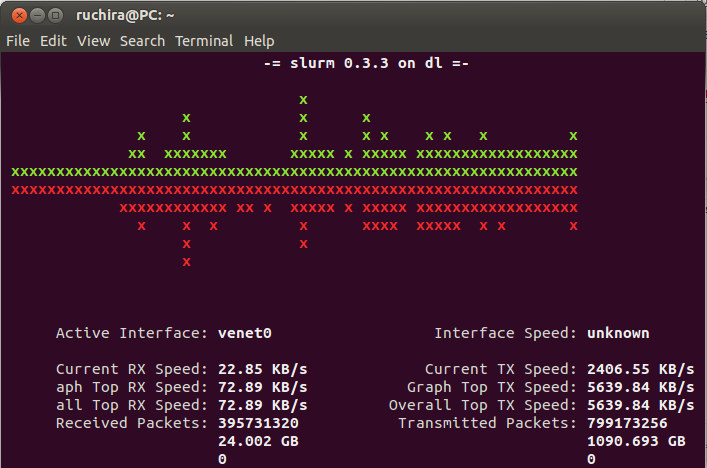
Slurm is my new favorite in this category. Screenshot above shows how “Slurm” shows you the data. “Slurm” is available on the default Debian/Ubuntu package repository and To install “Slurm” on your Linux server just run
Using Slurm is also very easy. Just run the command below to view statistics like shown above
You need to replace the interface according to your system. For example OpenVZ systems use “venet0″ as the ethernet interface and to view stats on a OpenVZ VPS use, “slurm -i venet0″

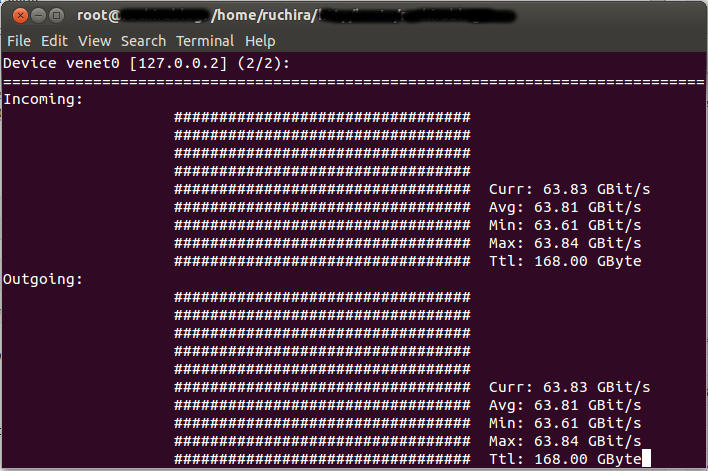
Nload is also a very nice command line bandwidth monitor utility just like slurm. However I prefer slurm since it displays more data and its worth to note that Nload doesn’t work correctly on some OpenVZ kernels. So if you have a OpenVZ VPS, Nload might not work correctly and will display wrong results as shown on the above screenshot. However in my experience it works well on KVM,Xen and Dedicated servers.
Nload is also available on the default repository of Debian/Ubuntu. To install Nload just run
And to view data run,
When you run Nload it will display the statistics of loopback interface. To monitor the Ethernet port, click the down arrow key on your keyboard. You can navigate between the interfaces by using the up and down arrows.

